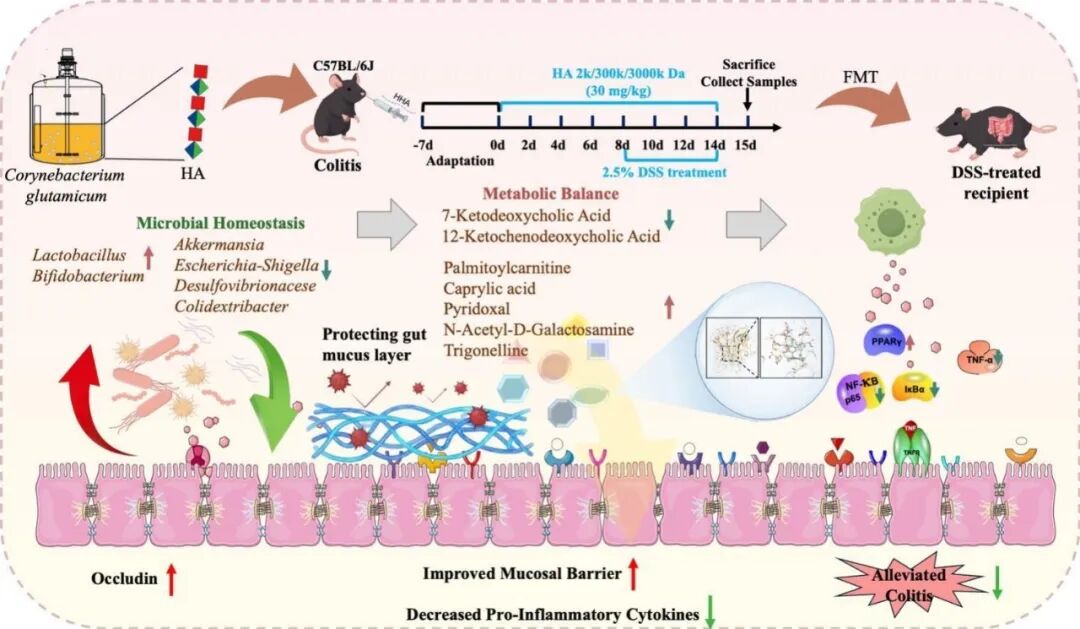
透明质酸(HA)是治疗溃疡性结肠炎(UC)的潜在候选药物,但其分子量如何影响疗效以及相关的菌群机制尚不明确。近期,江南大学糖化学与生物技术教育部重点实验室康振研究团队利用生物技术制备了不同分子量的透明质酸(LHA,2 kDa;MHA,300 kDa;HHA,3000 kDa),并在葡聚糖硫酸钠诱导的小鼠结肠炎模型中进行了系统评估。研究发现,HA的保护作用呈现分子量依赖性趋势,其中高分子量透明质酸(HHA)效果最为显著。HHA能有效减轻结肠炎的临床表现,保护结肠组织结构,并恢复由紧密连接蛋白(Occludin, ZO-1)和黏蛋白构成的上皮屏障功能。在机制上,HHA能够减轻系统性炎症(如降低TNF-α, IL-1β和LPS水平),并调控NF-κB/PPARγ信号轴。通过16S rRNA测序和非靶向代谢组学分析,研究进一步揭示HHA重塑了肠道生态系统,富集了有益菌属(如双歧杆菌和乳杆菌),并促进了代谢稳态,其特征是维生素B6相关代谢物和脂肪酸的增加,以及嘌呤代谢的降低。分子动力学模拟提示,菌群相关的吡哆醛可能与TNF-α存在结合作用,为观察到的炎症信号减弱提供了结构上的假设。更重要的是,粪菌移植实验证明,HHA重塑后的菌群本身足以传递对结肠炎的保护作用。总而言之,这项研究证实HHA是一种通过协同调控“菌群-代谢-免疫”轴来改善结肠炎的生物活性多糖。
研究背景
溃疡性结肠炎(UC)是炎症性肠病(IBD)的主要亚型,其特征为慢性、复发性黏膜炎症和上皮屏障破坏,常导致腹痛、腹泻和便血。全球UC负担持续加重,凸显了对有效且安全治疗策略的迫切需求。尽管其病因是多因素的,但新出现的证据表明,肠道上皮屏障受损、免疫反应失调和肠道微生物群改变是UC发病机制的关键因素。目前获批的药物,包括5-氨基水杨酸、皮质类固醇、免疫抑制剂和生物制剂,虽然可以诱导缓解,但存在显著的副作用、长期疗效有限和高复发率等问题。因此,天然多糖因其良好的生物相容性和抗炎活性而受到越来越多的关注。例如,近期研究强调了树莓果胶多糖在缓解结肠炎方面的功效,以及果胶稳定乳液在递送系统中的实用性。同样,透明质酸(HA),一种具有黏膜愈合潜力和极低毒性的生物相容性多糖,作为结肠炎治疗的候选药物也引起了越来越多的兴趣。在胃肠道应用中,HA展现出抗炎和上皮修复的效应,但其作用机制,特别是在分子量和与微生物群相互作用方面的研究,仍不充分。
在过去的五年中,我们的团队利用谷氨酸棒杆菌这一公认安全的底盘生物,通过合理的代谢工程、转运优化和适应性生物过程开发,建立了一个强大的微生物生产HA平台。我们通过结合UDP-GlcA途径增强、利用水蛭透明质酸酶解除荚膜,以及对源自链球菌的透明质酸合酶进行结构引导工程改造,实现了超过105 g/L的HA产量,且分子量可在53至1400 kDa范围内调控。AlphaFold2引导的StrHasA突变诱变使得高分子量HA(>1.4 MDa)得以分泌,同时保持了生产力。这些进展为我们提供了一系列具有明确平均分子量和适合体内评估的理化性质的HA聚合物。
基于这一生产平台,我们在DSS诱导的小鼠结肠炎模型中系统评估了不同分子量HA——低分子量HA(LHA)、中分子量HA(MHA)和高分子量HA(HHA)的治疗效果。虽然先前的研究表明,外源性HA可以通过保护上皮屏障和抑制细胞因子来减轻结肠炎症状,但其分子量依赖性效应和微生物群介导的机制仍未明确。鉴于肠道微生物群在上皮完整性、免疫调节和代谢物信号传导中的关键作用,我们假设HHA将通过增强黏膜屏障完整性并重塑微生物群相关的炎症和代谢信号,提供更一致的保护趋势。
研究内容
在本研究中,我们评估了LHA、MHA和HHA对临床疾病参数、上皮屏障标志物、系统性炎症、肠道微生物组成和微生物衍生代谢物的影响。进一步采用功能预测工具和粪菌移植来剖析因果关系。我们的研究结果表明,HHA显著改善结肠炎症状,增强紧密连接完整性,抑制促炎信号,并重新建立肠道微生物和代谢稳态。这项工作不仅验证了HHA作为一种具有调节微生物群潜力的生物活性碳水化合物聚合物用于UC治疗,而且还提供了关于HA如何调控“微生物群-代谢物-宿主”信号轴的机制见解。
研究结果
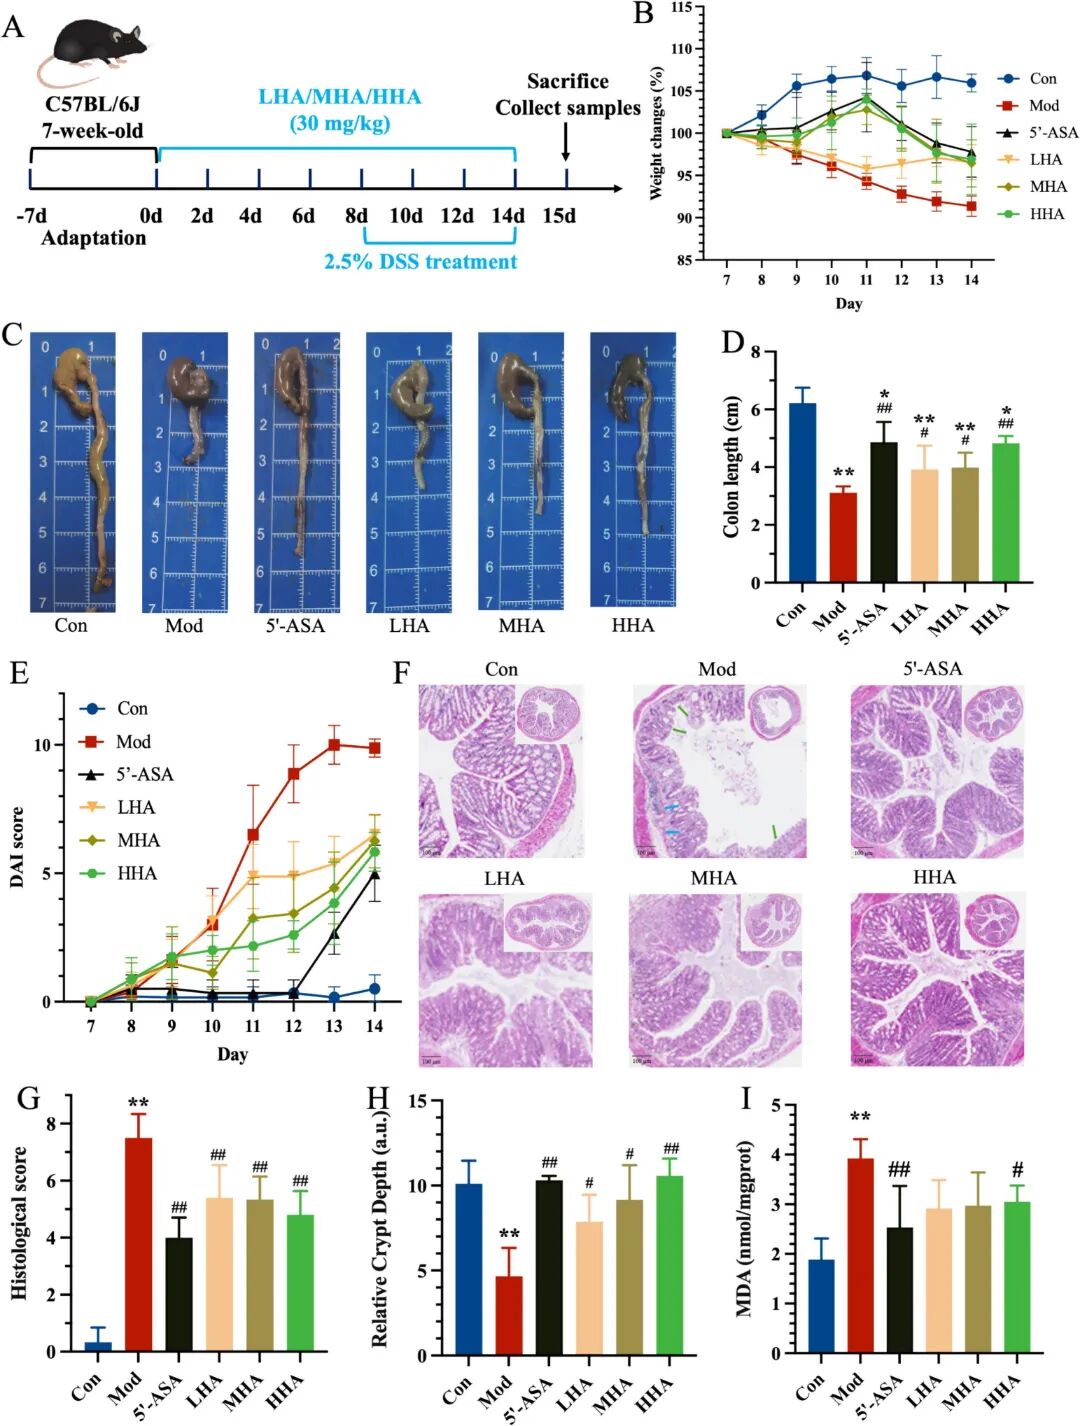
Fig. 1. In vivo evaluations of the difference Mw of HA therapeutic effects on DSS-induced colitis. (A) Schematic illustration of treatment regimens in vivo. (B) Body weight changes during the DSS challenge (days 8-14) (n = 6). (C) Representative colon images of each group on day 14. Additional representative images (n = 3) demonstrating group consistency are provided in Supplementary Fig. S4A. (D) Lengths of the collected colonic tissues. H&E-stained histological sections of colonic tissues. (E) DAI scores (time-course) during the DSS challenge. (F) Representative H&E-stained sections of distal colon. (G) Histological scores based on inflammation severity and crypt damage. (H) relative crypt depth (a.u.). (I) MDA levels in colonic tissues. Symbols indicate: P < 0.05 and P < 0.01 versus Con group; # P < 0.05, ## P < 0.01 versus Mod group.
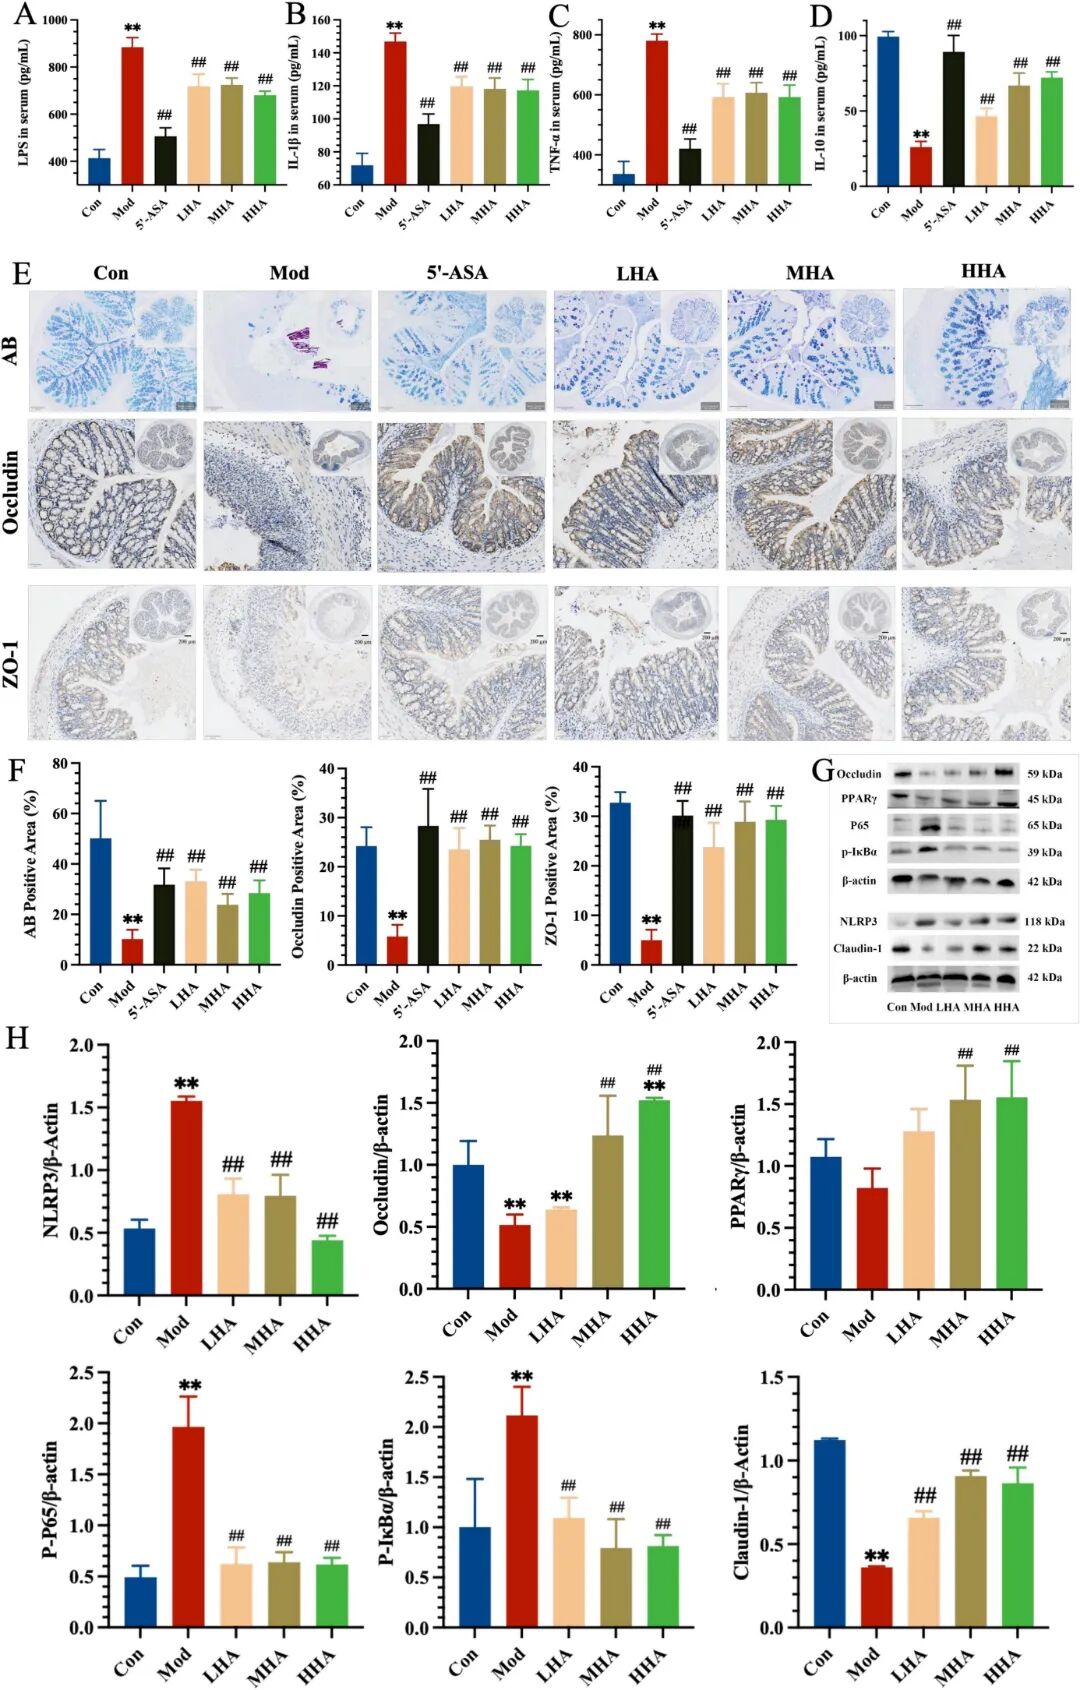
Fig. 2. Anti-inflammatory and barrier-protective effects of HA in DSS-induced colitis. (A-D) Serum levels of LPS, IL-1β, TNF-α, and IL-10 were determined by ELISA (n = 6). (E) AB staining (top), Occludin IHC (middle), and ZO-1 IHC (bottom). (F) Quantification of AB-positive area, Occludin-positive area, and ZO-1-positive area. (G) Western blot analysis of NLRP3, Occludin, PPARγ, p65, and p-IκBα, Claudin-1 expression in colon tissues. (H) Densitometric quantification of Western blot bands normalized to β-actin. Symbols indicate: P < 0.05 and P < 0.01 versus Con group; # P < 0.05, ## P < 0.01 versus Mod group.
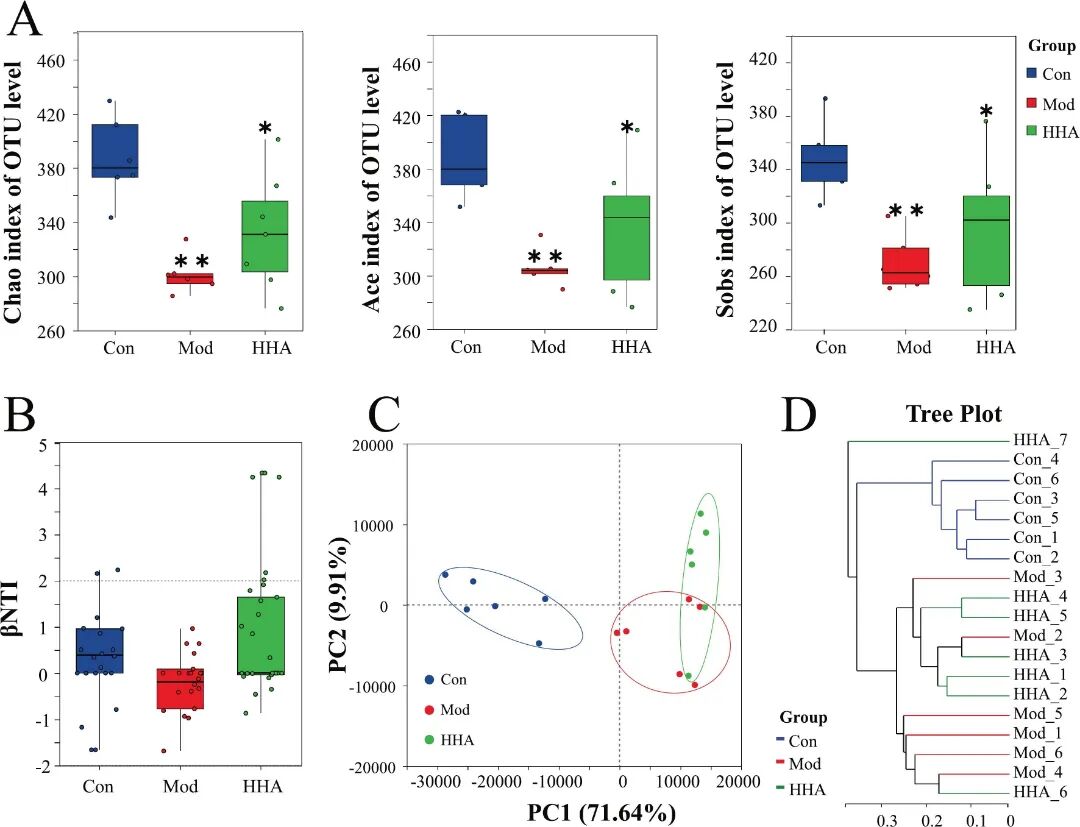
Fig 3. HHA treatment restores gut microbial diversity and community structure in DSS-induced colitis mice. (A) α-diversity indexes (Chao, ACE, and Sobs) of OTU level across groups. (B) βNTI analysis showing inter-group microbial structure divergence. (C) PCA based on genus-level relative abundance. (D) Phylogenetic tree showing sample clustering at the genus level. Data are presented as mean ± SEM (n = 6). P < 0.05, P < 0.01 versus Con group; # P < 0.05, ## P < 0.01 versus Mod group.
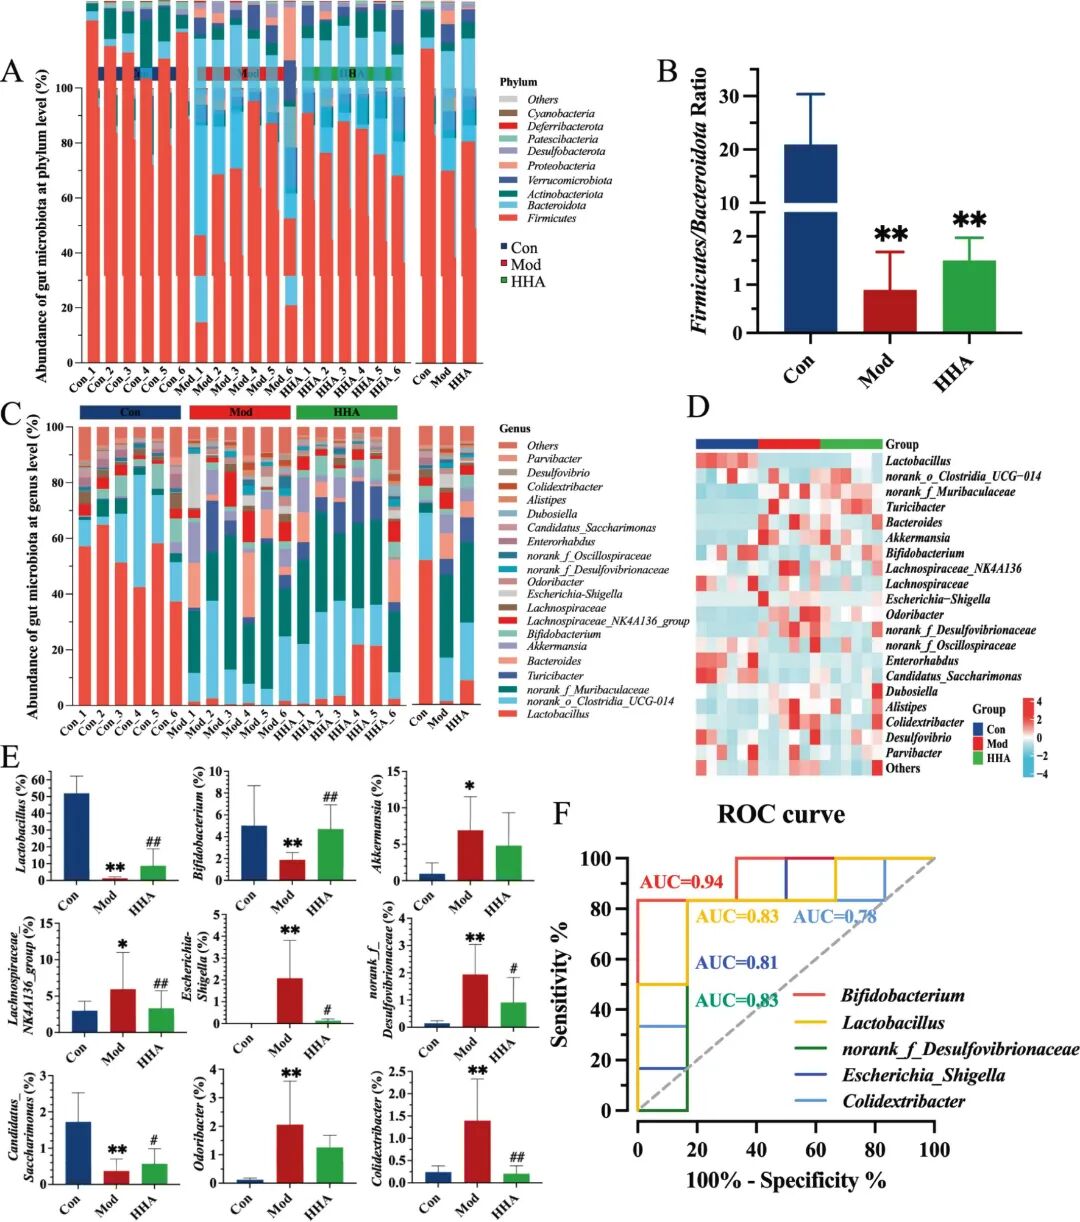
Fig 4. HHA modulates gut microbial composition and identifies key microbial biomarkers. (A) Phylum-level taxonomic composition. (B) Firmicutes/Bacteroidota ratio. (C) Genus-level taxonomic composition. (D) Heatmap showing differentially abundant genera among groups. (E) Relative abundance of genus-level microorganisms using the Kruskal-Wallis rank sum test. (F) ROC curves of microbial genera discriminating Mod versus HHA groups. P < 0.05, P < 0.01 versus Con; # P < 0.05, ## P < 0.01 versus Mod.
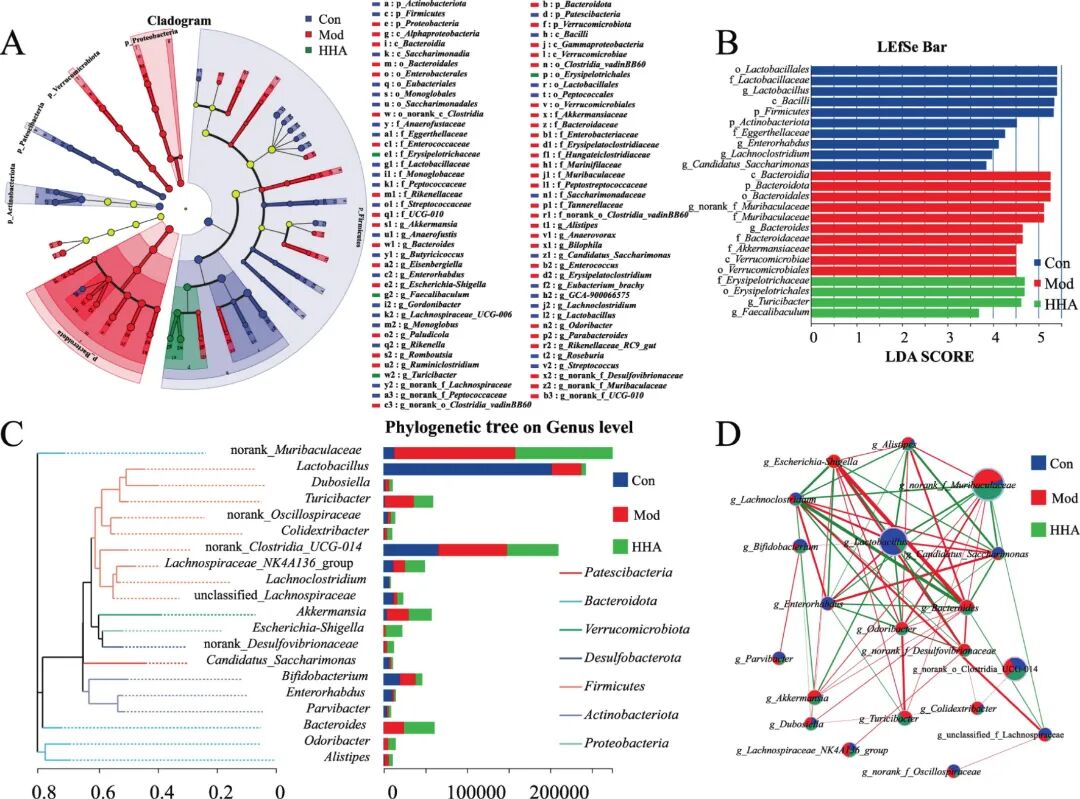
Fig 5. Identification of key microbial biomarkers and network-level shifts after HHA intervention. (A) Cladogram of differentially enriched taxa among Con, Mod, and HHA groups based on LEFSe analysis. (B) LDA score plot of significant taxonomic biomarkers (LDA > 2.5). (C) Phylogenetic tree at the genus level showing the relative abundance and phylum affiliation. (D) Co-occurrence network among predominant genera, where red lines denote positive correlations and green lines negative interactions.
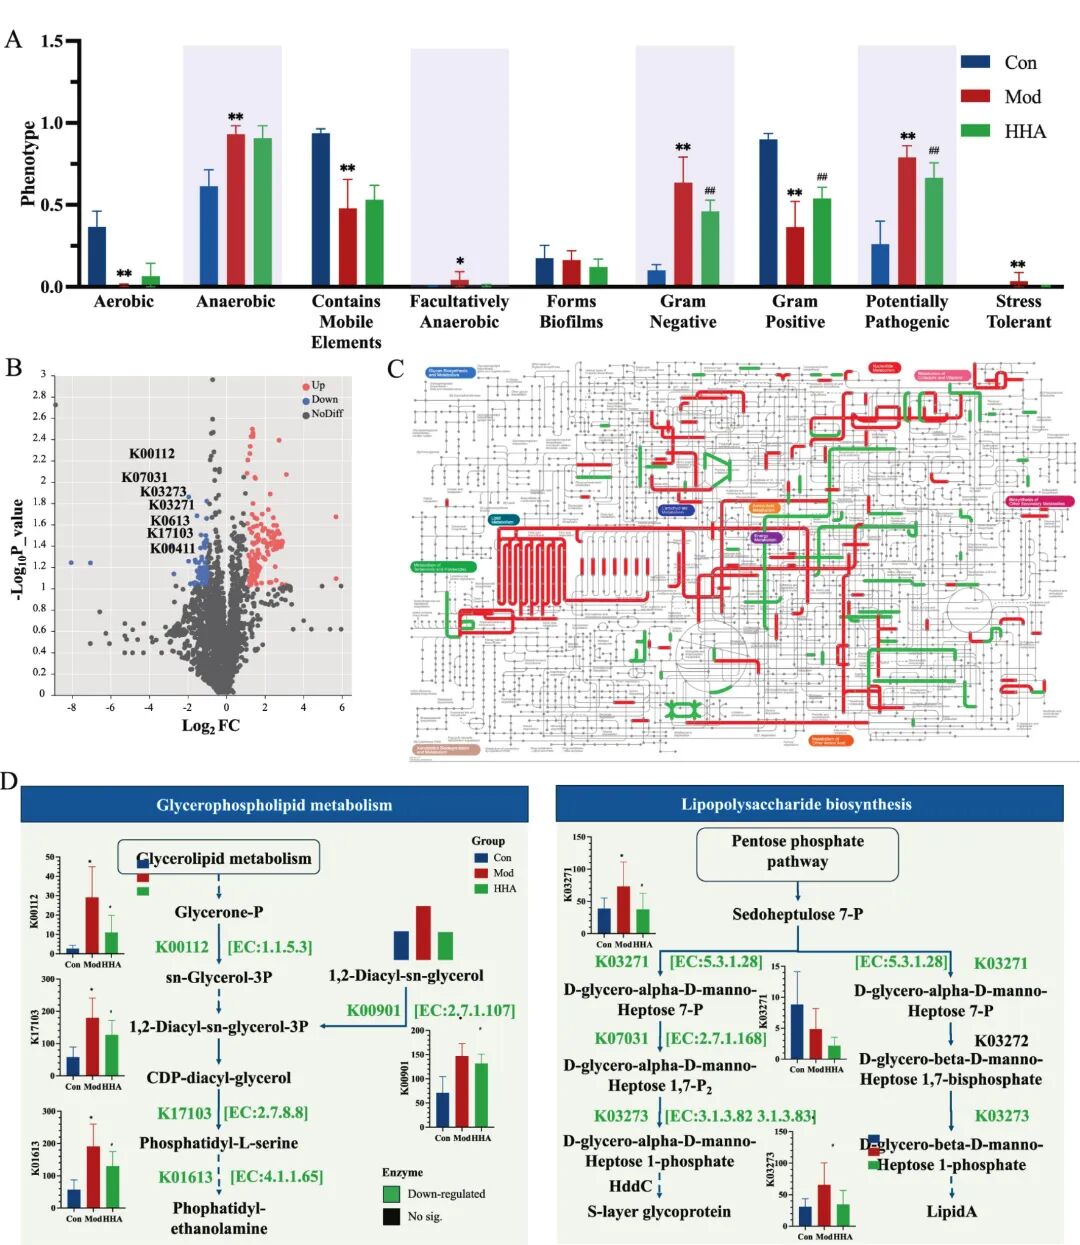
Fig 6. Functional remodeling of the gut microbiota by HHA based on BugBase and PICRUSt2 prediction. (A) BugBase-predicted bacterial phenotypes across groups: aerobic, anaerobic, Gram-positive, pathogenic, and stress-tolerant traits. (B) Volcano plot showing differentially abundant KEGG Orthology (KO) terms between HHA and Mod groups. (C) Global KEGG metabolic map with highlighted differential pathway activity (red: HHA upregulated, green: Mod upregulated); (D) Detailed metabolic reconstruction of key altered pathways: Glycerophospholipid metabolism (left) and LPS biosynthesis (right), with KO terms, enzyme names, and predicted KO abundance across groups.
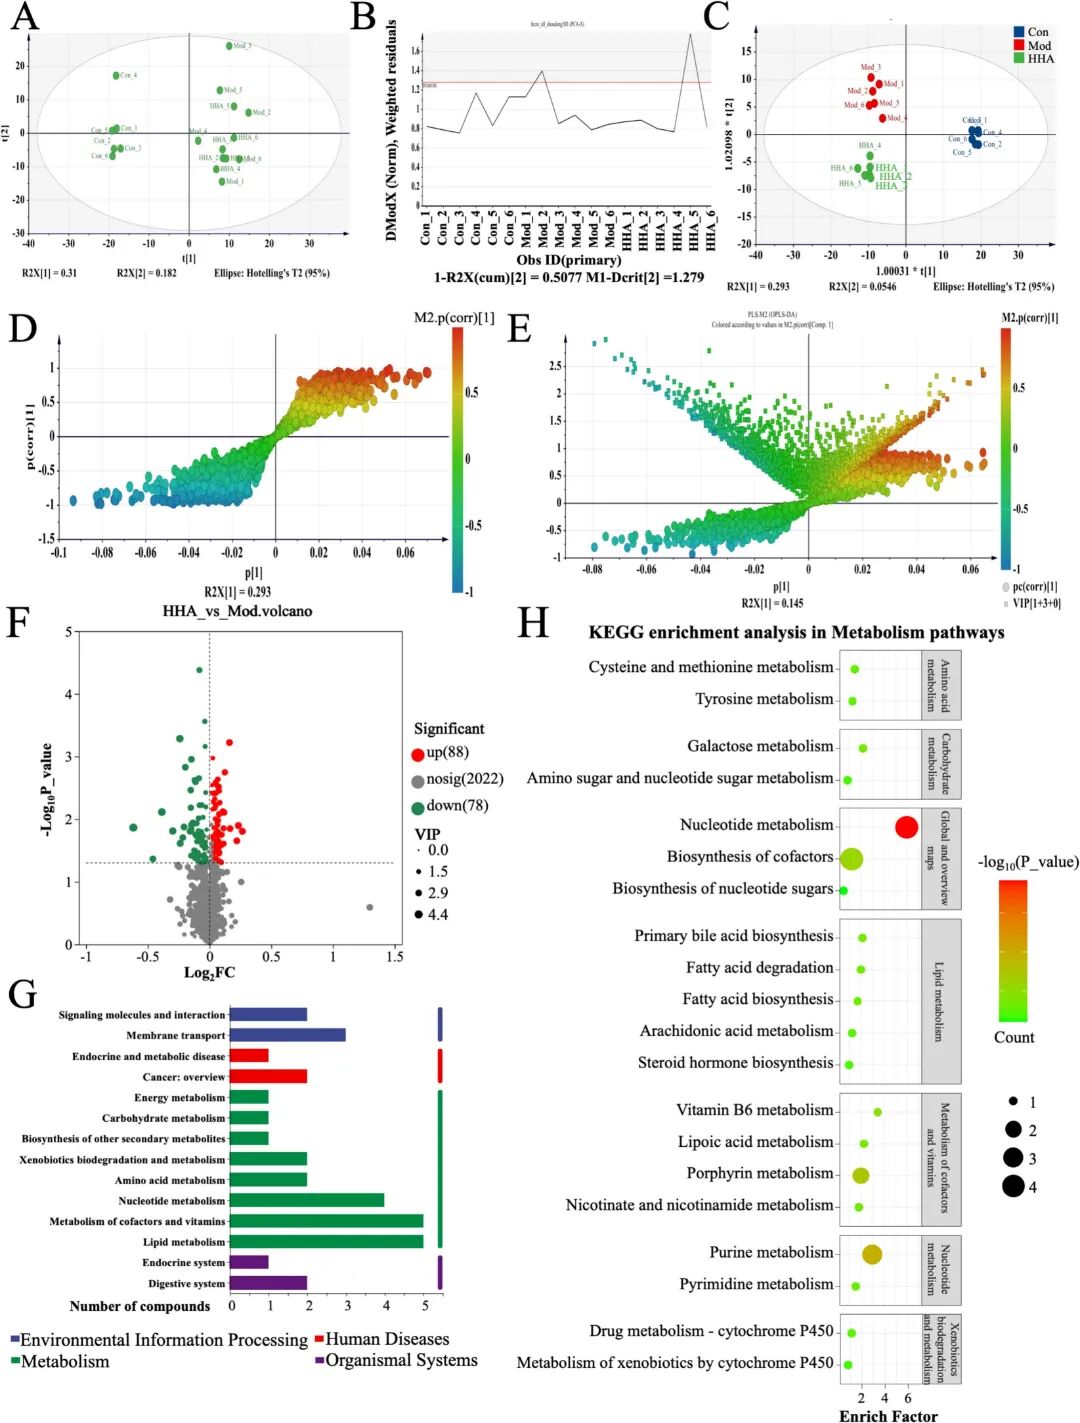
Fig 7. Effects of HHA on fecal untargeted metabolome in DSS-induced colitis mice. (A) PCA plot showing distinct clustering among groups. (B) DMoDx residuals confirming OPLS-DA model reliability. (C) OPLS-DA scores plot discriminating Con, Mod and HHA groups. (D-E) S-plot and loading scatter plot identifying key discriminative metabolites (HHA versus Mod). (F) Volcano plot (HHA versus Mod). (G) KEGG level-1 functional classification of the significant metabolites (HHA versus Mod). (H) KEGG pathway enrichment bubble plot for metabolic pathways (HHA versus Mod).
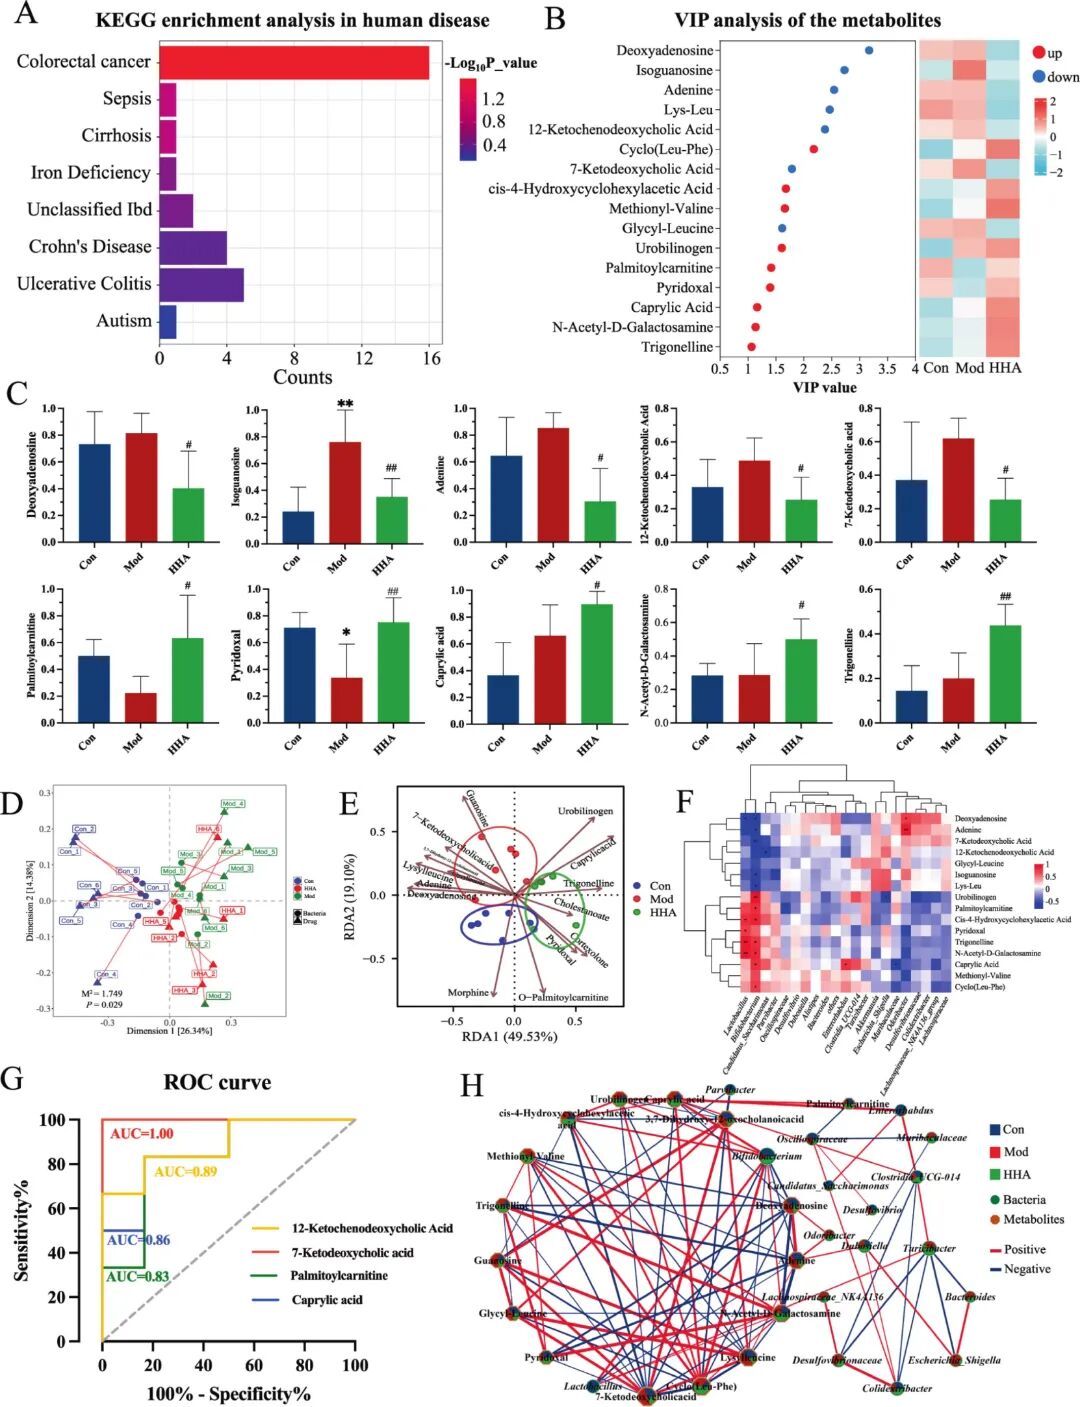
Fig 8. Integration of metabolomic and microbiome data identifies key biomarkers and metabolic recovery. (A)KEGG "Human Disease" enrichment of differential metabolites. Bar colour indicates -log10(P_value); colorectal cancer ranked first (16 hits, P < 0.01), followed by IBDs. (B) VIP ranking of the top 15 metabolites (left) alongside a heatmap across Con, Mod and HHA groups (right). (C) Bar plots of 10 representative metabolites. (D) Distance-based RDA (db-RDA) ordination of bacterial communities (arrows) and sample centroids. PERMANOVA indicated significant group separation (M⟡ = 1.149, P = 0.029). (E) RDA biplot linking the top 12 differential metabolites (brown vectors) with sample distribution along RDA1 (49.53%) and RDA2 (19.10%). (F) Spearman correlation heatmap between 15 key metabolites and significantly altered bacterial genera (|ρ| ≥ 0.5, FDR < 0.05). (G) ROC curves for four representative metabolites. (H) Co-occurrence network of bacteria (squares) and metabolites (circles) (|ρ| ≥ 0.5, FDR < 0.05). P < 0.05, P < 0.01 versus Con; # P < 0.05, ## P < 0.01 versus Mod.
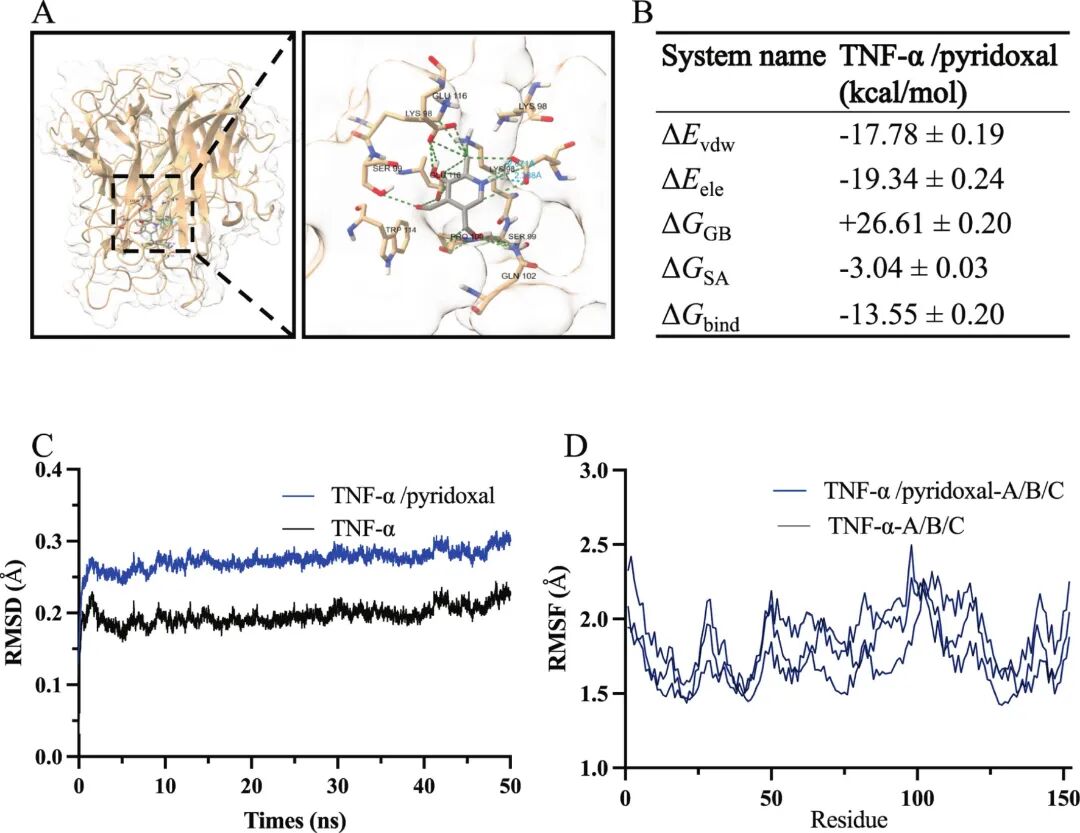
Fig 9. MD of TNF-α in the absence and presence of pyridoxal. (A) Representative binding pose of pyridoxal in the TNF-α pocket. (B) MM/GBSA binding free energy decomposition. (C) Backbone RMSD trajectories showing apo TNF-α ~0.18 - 0.23 nm and the TNF-α/pyridoxal complex ~0.23 - 0.31 nm. (D) RMSF profiles.
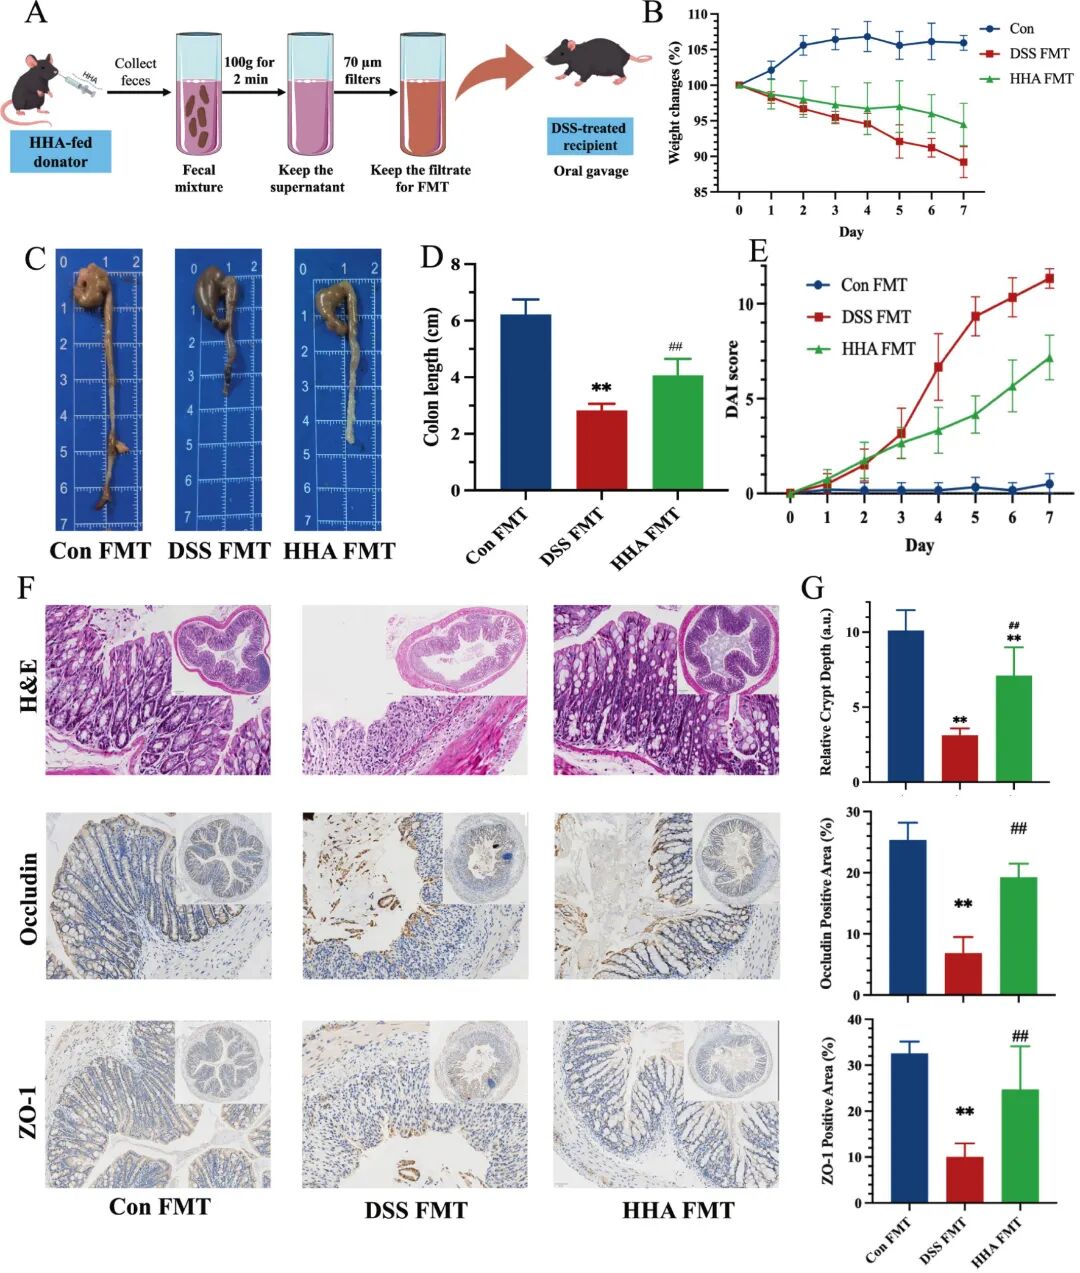
Fig 10. FMT using HHA-shaped microbiota alleviates DSS-induced colitis in recipient mice. (A) Experimental workflow. (B) Body-weight changes (% of day 0) during the 2.5% DSS challenge. (C) Representative images of colons on day 7. See Supplementary Fig. S4B for additional representative images. (D) Colon length (cm). (E) DAI scores (time-course) during the DSS challenge. (F) Representative H&E-stained colon tissues (top), Occludin and ZO-1 IHC (bottom). (G) Quantification of Relative crypt depth (a.u.), Occludin-positive area and ZO-1-positive area. Data in D, E and G are mean ± SEM (n = 6). P < 0.05, P < 0.01 versus Con FMT; ## P < 0.01 versus DSS-FMT.
研究结论
总之,HHA在关键的结构和炎症指标上显示出更优的总体趋势,并被选为进行机制分析的代表性候选物。HHA能有效减轻体重下降、结肠缩短和DAI评分升高等临床症状,同时恢复黏膜结构、杯状细胞功能和紧密连接完整性。这些保护作用伴随着系统性炎症的抑制,表现为血清LPS、IL-1β和TNF-α水平降低,以及对NF-κB/PPARγ信号轴的调控。
在机制上,HHA通过“菌群-代谢-免疫”轴减弱炎症信号:首先,通过富集有益菌群和减少致病菌属,重塑上游的肠道微生物群。这种微生物变化重新编程了功能通路,下调LPS生物合成和甘油磷脂代谢,同时上调脂肪酸生产和维生素B6合成,这一点已通过PICRUSt2预测和非靶向代谢组学得到证实。中游的代谢调节通过转硫途径和胆汁酸-FXR/TGR5信号增强了抗氧化防御,最终导致下游免疫抑制、氧化应激降低和屏障功能恢复。此外,HHA调节后的粪菌移植实验证实了这些治疗效应在受体小鼠中的传递,确认了肠道微生物群作为HHA益处的功能性介质的作用。这些发现确立了HHA作为一种有前景的靶向微生物群的IBD治疗剂,并强调了将膳食HHA补充剂与基于微生物组的干预措施(如FMT)相结合的转化潜力。


 微信服务号
微信服务号
 微信订阅号
微信订阅号
 微信订阅号
微信订阅号